|

|

|
 |
-

-

-

-

|
 |
|
Familiarize yourself with the database you would like
to query. There are five different databases, each one will provide information on very specific health
related events. You should be aware of the purpose, content and limitations of each
one of them. Click on each database to learn more about it:
|
 |
|
Detailed information about the data elements for each database used in the Reporting System can be found in the
following links:
|
 |
 |
|
The query form is divided into two components: the QUERY CRITERIA and the RESULTS LAYOUT. The QUERY CRITERIA section of the form contains
all the database's data elements you can query on and their specified options. The RESULTS LAYOUT section
gives you options on how your results should be displayed.
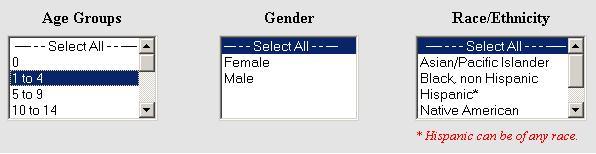
1. For each data element, you have the choice of selecting all categories ("Select All") or
refining the query to a specific group. For example, if you would like to obtain findings for the age group "1-4," females and males
of all ethnic/racial backgrounds, follow these steps:
-
First select the AGE GROUP "1-4" by clicking the mouse on this option.
-
Next, select "Select All" for GENDER.
-
Also select "Select All" for RACE/ETHNICITY.
|
|
|
To choose more than one contigous category (e.g., age groups 5-9,10-14, and 15-19), click the mouse on the first
option, and without releasing your finger from the mouse continue highlighting your other options. To choose
non-contiguous options (e.g., Boone and Will counties only) hold the control key while clicking individually
on each
one of the desired categories.
|
 |
|
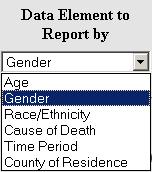
2. At this point, you have gone through all data elements and made the selections that are key to your search.
You may now scroll down the page to the DATA ELEMENT TO REPORT BY drop down menu and select the DATA ELEMENT that
you would like to report by. For example, if you select GENDER, your statistics will be reported by gender.
|
|
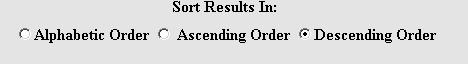
3. Move to the SORT RESULTS IN section and select whether you want your findings to be reported in alphabetic, ascending, or descending frequencies order.
|
|
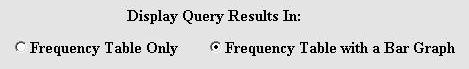
4. Next, you can opt for frequency table results only, or for the addition of a bar graph
to the tabular results.
|
|
5. You are now ready to submit your query by clicking on the SEND QUERY button.
If you need to revise your query at this point,
just press the CLEAR PREVIOUS SELECTIONS button and begin again.
|
|

|
|
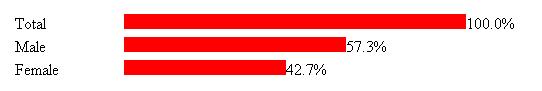
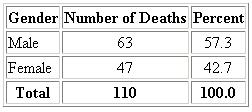
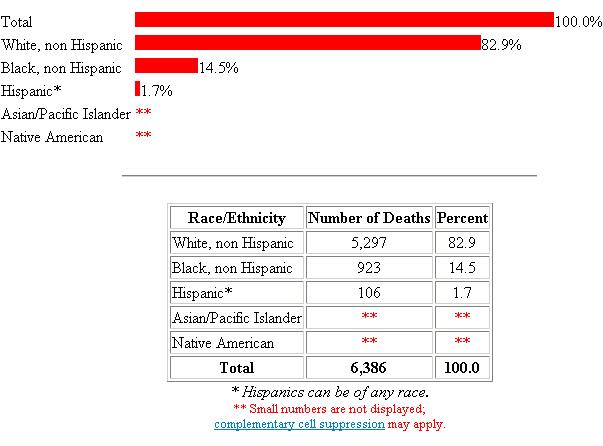
6. As seen below, your findings will be displayed in a bar chart and/or a
frequency table format.
|
|
|
|
Please note that, if applicable, limitations of the data will be printed
directly below the results table.
It could be a note about database limitations or a cell suppression rule that
was applied to
the results.
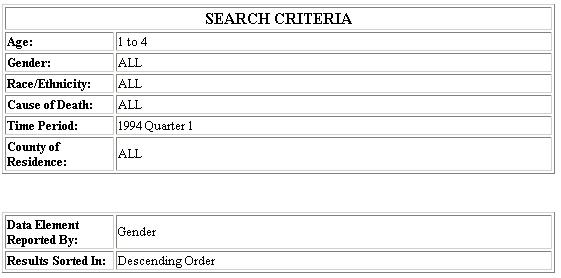
The query criteria you defined previously is printed in a table at the bottom of the results page.
|
|

|
|
The EMS Reporting System contains safeguards to ensure data confidentiality.
Among them are the cell suppression rules
and data aggregation.
Cell Suppression Rules: If your query results include a finding of five or less in any category,
data for that particular category will not be displayed.
Complementary
cell suppression may
also be applied to your results, if only one row category has its frequency suppressed.
In this case, the next lowest frequency (which will be greater than five) will also be suppressed.
You may consider broadening your search criteria, if you wish to avoid cell suppression.
Data Aggregation Rule: In certain cases, grouping of two or more
categories of the results table may occur. Aggregation may be used either as an
alternative to cell suppression or in conjunction with it.
|
 |
|
To run a query, please select the Query Form option in the
navigation bar for the desired database.
 Back To Previous Page Back To Previous Page
Back to Top
|